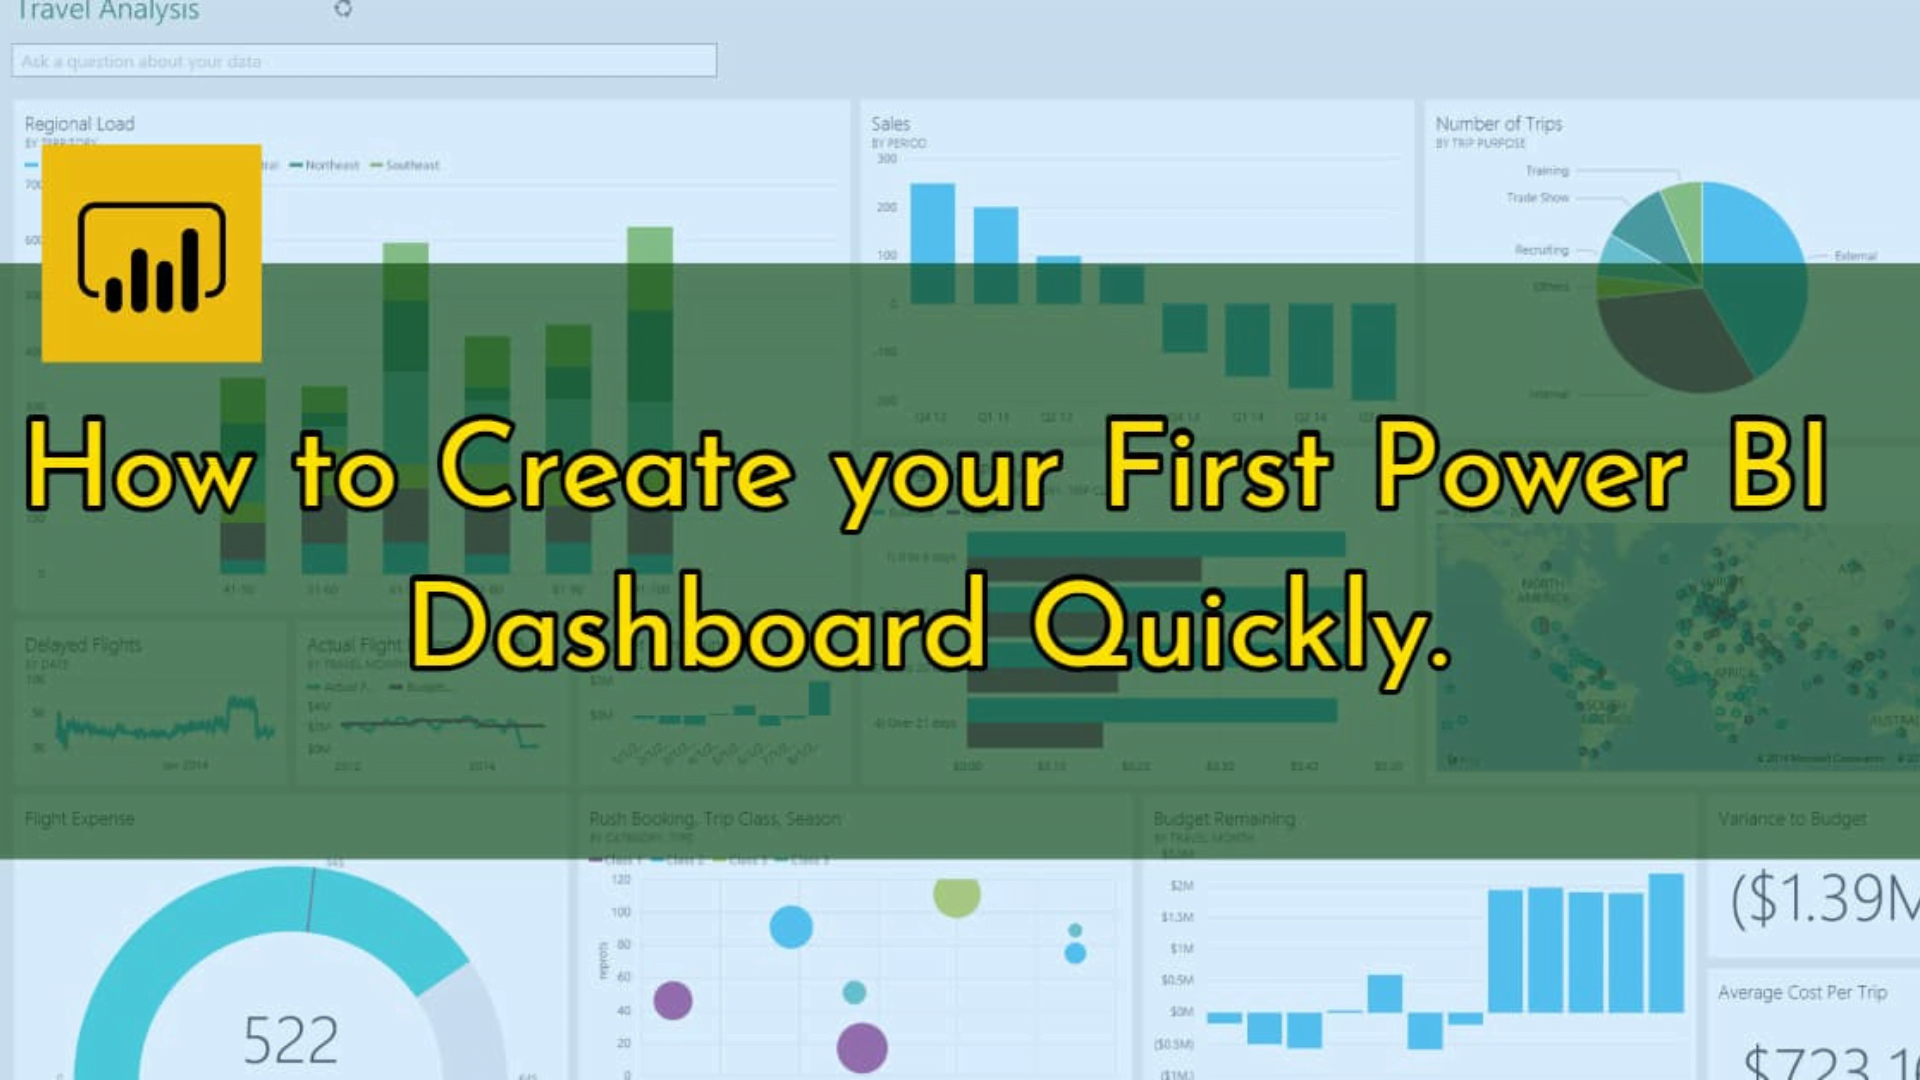
How to build a Power BI dashboard?

Power BI Dashboard is a single-page visualization to tell a story, often called a canvas. The visualizations that are snapshots of data pinned to the dashboard are called tiles. The visualizations on a dashboard originate from reports, datasets, the dashboard, the Q&A box, Excel, SQL Server Reporting Services (SSRS) information, and more.
There are different ways to create a dashboard. For example, you can create a dashboard from a report, scratch, or dataset or duplicate an existing dashboard.
Steps for Creating Power BI Dashboards
Step1: Import Data
- In Power BI Desktop, select Get data from the Home ribbon tab.
- Choose a data source
- Connect
Step 2: Format the Data
Once data is imported, Power BI starts processing it and organizes it based on what it has found in the Navigator Window. Before loading the data, you have the option to format it. To do this, select the “Transform Data” available at the bottom of the page. If formatting is not required, click on “Load.”
Step 3: Create Visualizations for the Power BI Dashboards
You can incorporate different visualization elements by clicking on any Bar, Pie, Donut chart, or other data visualization methods and types under the Visualizations tab.
Step 4: Save & publish your dashboard
Once you have created your dashboard and populated it with insightful charts, click on the Save button on the toolbar. So by following small steps, you can publish your first dashboard. This is an overview and can cover a lot of things in Power BI, which we covered in our following articles. You can visit our services section for our offering for the POWER BI.
For more information, contact us

